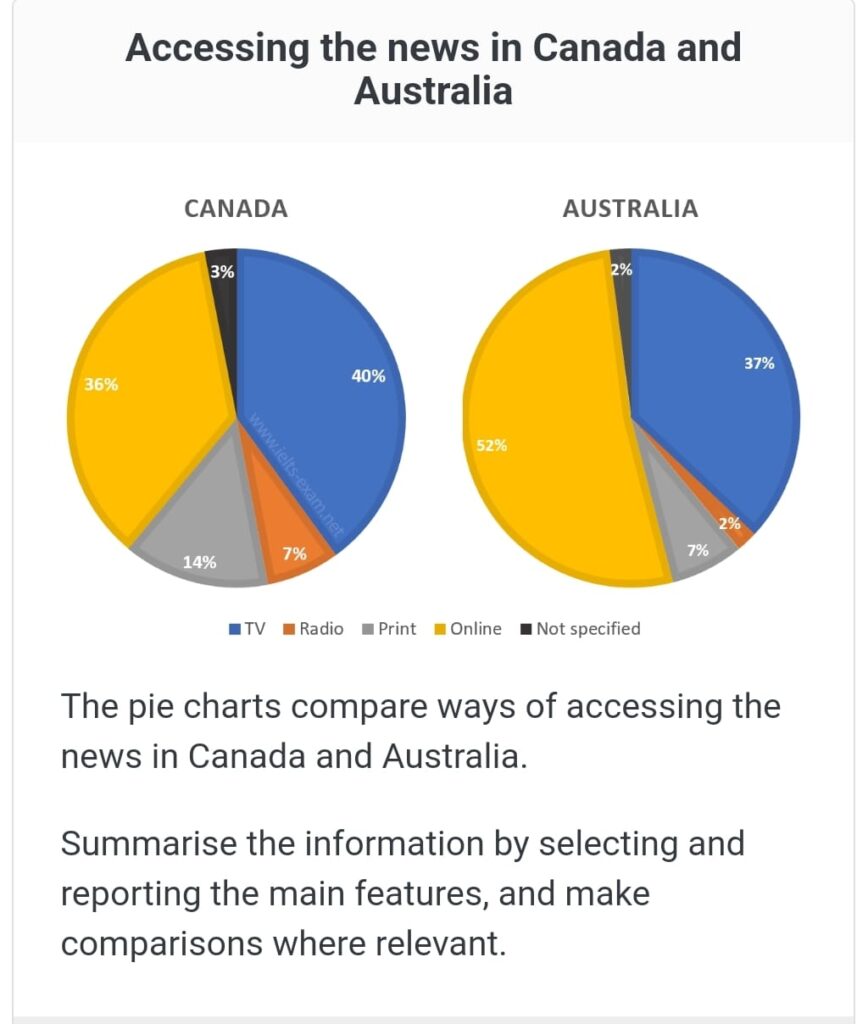
The pie charts illustrate the primary means by which individuals in two distinct countries, Canada and Australia, acquire news. While the overall patterns in both nations exhibit similarities, significant and minor divergences exist.
A striking observation from the data is that in Canada, just over a third of the population accesses news online, whereas in Australia, this proportion surpasses half, reaching 52%. It is evident that television news viewing enjoys popularity in both countries, with approximately two-fifths of the Canadian population favoring this mode of information consumption, a figure only 3% less than that in Australia.
A notable dissimilarity between Canada and Australia is the preference for print news, where over twice as many people in Canada opt for this medium compared to Australia—14% and 7%, respectively. Similarly, listening to the news on the radio is favored by three times as many individuals in Canada compared to Australia.
In summary, the prevalence of internet usage in Australia is notably high, resulting in diminished reliance on alternative news sources such as radio and print when compared to Canada.