Summarize the information by selecting and reporting the main features, and make comparisons where relevant.
IELTS Academic Writing Task 1 – Sample Answer
Introduction
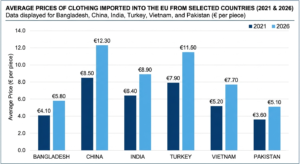
This bar graph depicts variations in the average prices of clothing items imported into the European Union from six selected countries—Bangladesh, China, India, Turkey, Vietnam, and Pakistan—across two specific years, 2021 and 2026. As reflected by the Y-axis, the cost is measured in Euros (€) per piece, ranging from 0.0 to 14.0 with intervals of 2.0.
Overview
At first glance, it becomes clear that clothing import prices from all six nations experienced an upward trend over the five-year period. Apparel from China and Turkey maintained the highest market values in both years, while items coming out of Pakistan and Bangladesh remained the least expensive. Overall, the most significant price escalation occurred in imports from China and Turkey, whereas the growth in prices for Pakistani and Vietnamese garments was much more modest.
Detailed Analysis
In more detail, clothing imported from China carried the highest price tag in 2021 at €8.50 per piece and surged by €3.80 to reach a peak of €12.30 in 2026. Similarly, Turkish imports started at a high of €7.90 in 2021 and rose substantially to €11.50 by 2026. Garments from India also saw a notable increase, climbing from €6.40 to €8.90 over the same timeframe.
Conversely, the bottom tier of clothing costs was occupied by Bangladesh and Pakistan. In 2021, Bangladeshi garments averaged €4.10 and grew to €5.80 by 2026. Pakistani imports, which were the cheapest overall in 2021 at €3.60, saw the smallest growth margin, increasing by only €1.50 to finish at €5.10 per piece. Meanwhile, Vietnamese clothing valuation showed a moderate trajectory, starting at €5.20 in 2021 and rising to €7.70 in 2026. In summary, while the EU paid higher rates for imports across all designated territories by 2026, a wide pricing gap persisted between premium-tier exporters like China and budget-friendly producers like Pakistan.
Key Strategies Applied:
- Beyond Simple Paraphrasing: The introduction explicitly calls out the parameters of the Y-axis (values from 0.0 to 14.0 with intervals of 2.0) and specifies the exact names of the countries rather than just saying “selected countries.”
- Advanced Overview: Instead of just declaring the single highest and lowest values, the overview groups the countries into clear patterns (high-tier vs. low-tier price structures).
- Precise Analysis: The body paragraph extracts exactly 7 distinct data points and calculates the margins of increase (e.g., China’s €3.80 increase) to showcase high-level data manipulation.